|
<< Click to Display Table of Contents >> Creating Your First Dashboard |
  
|
|
<< Click to Display Table of Contents >> Creating Your First Dashboard |
|
Creating a Dashboard
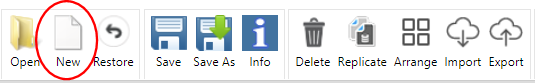
To create a dashboard, select the New button to open a new dashboard.
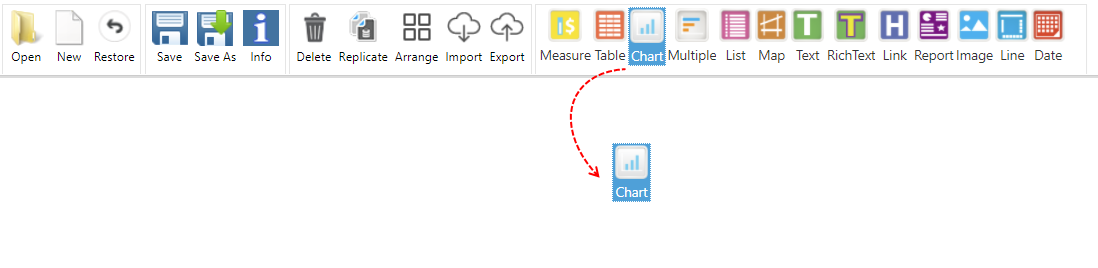
Next, select any of the component options and dragging it onto the dashboard, for this example we will be using the chart component. Once you have dropped the component onto the dashboard, a component wizard will pop up to guide you through the process of creating that component.
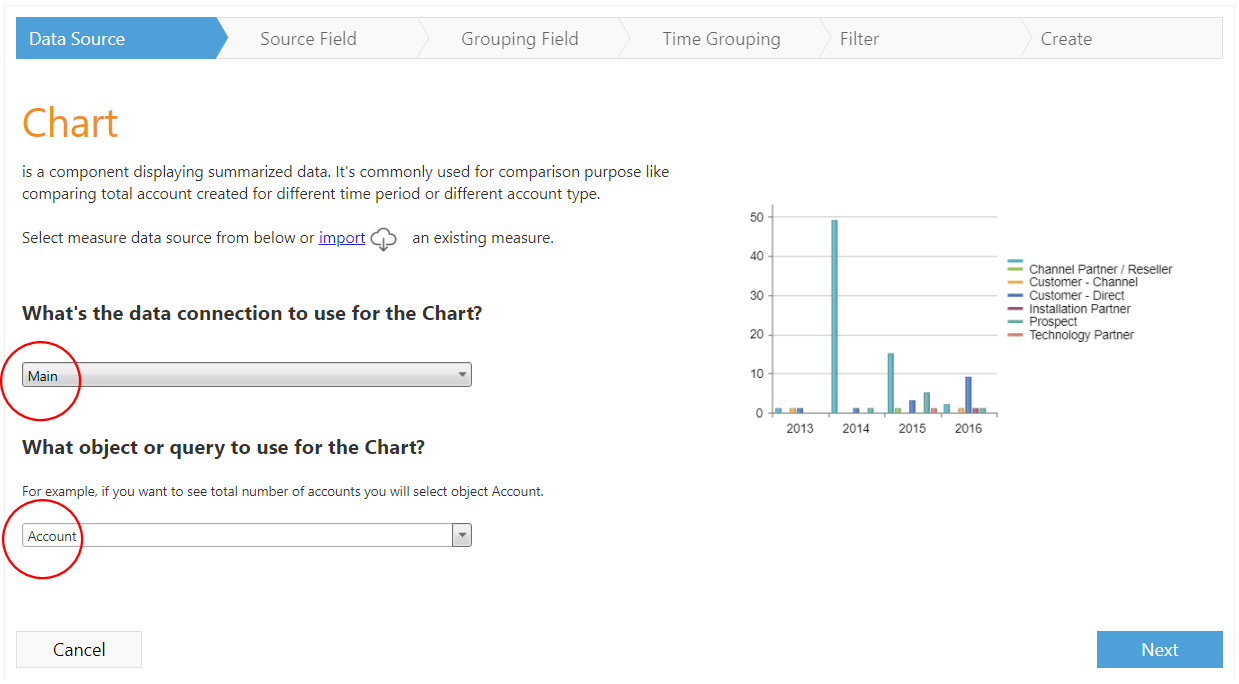
First, select a data connection (Main is the Salesforce instance an user is currently in.) for the component you are creating, a list of objects and queries will be available after the connection selection is made. Next, select an object or query to get data from, then click next.
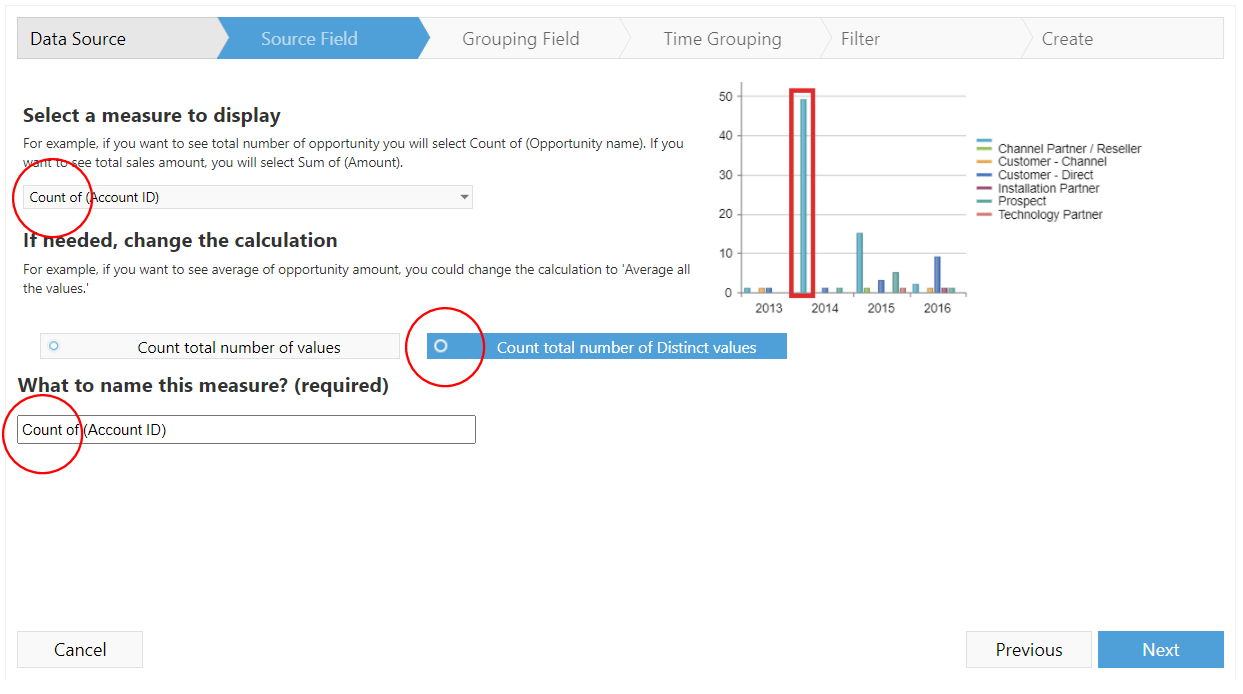
Next, select a data field to calculate from and assign it a name. Once this is done, the compatible calculations will appear, select how you would like to calculate the field. You can rename the measure to something more meaning to you or use the default name displayed. Click next.
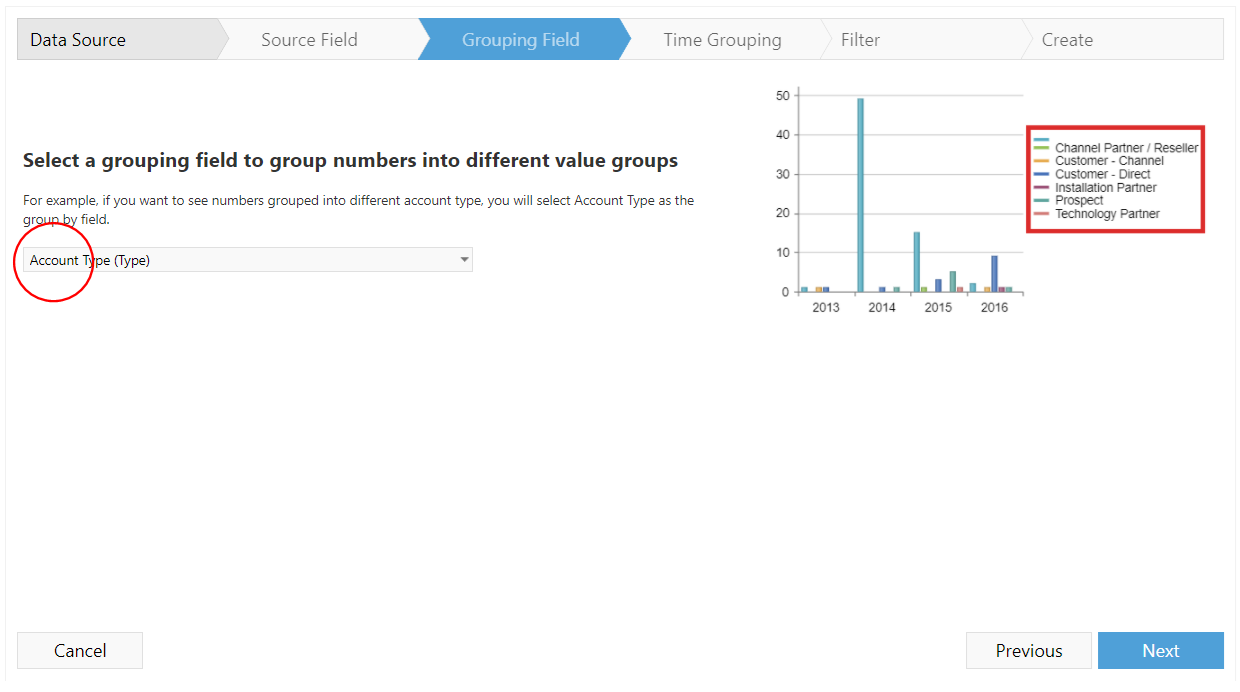
Now, select the grouping field by which you wish to categorize these numbers. For example, if you select account type as your data field, you would be able to categorize your earnings in terms of new customers and existing customers. But, if you select regional or state as the field then you would be able to see your sales in terms of the geographic location in which your customer is located.
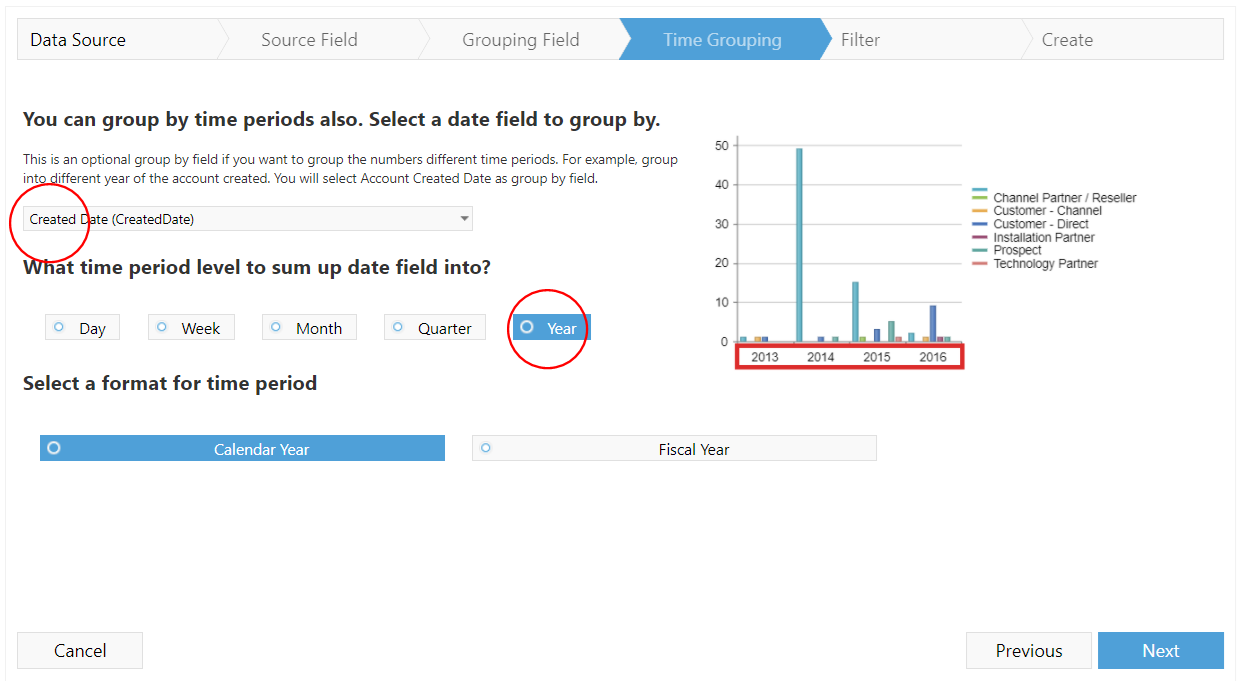
In addition, you can also select a time grouping in order to further customize your chart, this feature allows you to categorize these calculations by time period. To do this, select the time period you wish to observe and the format in which you wish for it to be displayed, then click next.
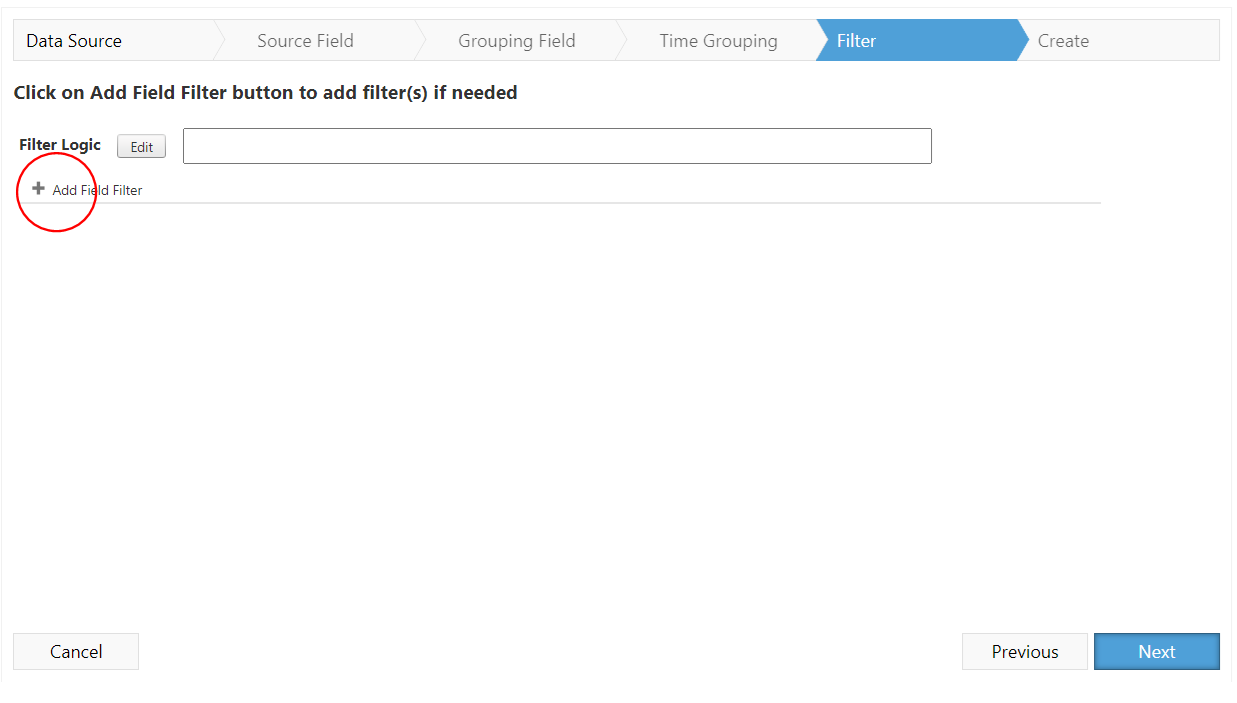
Add filter(s) if needed. Refer to Filter section of Component Data for more details about filter. Click on Next. Now you are done!
Once the component is created you can resize or reposition it however like. When the blue bar on top of each component is displayed, that means that the component is selected. To drag and drop the component, simply hover your mouse above the blue bar, click and hold the cross sign, then drag. To resize the component, click and hold a corner of the component and drag.
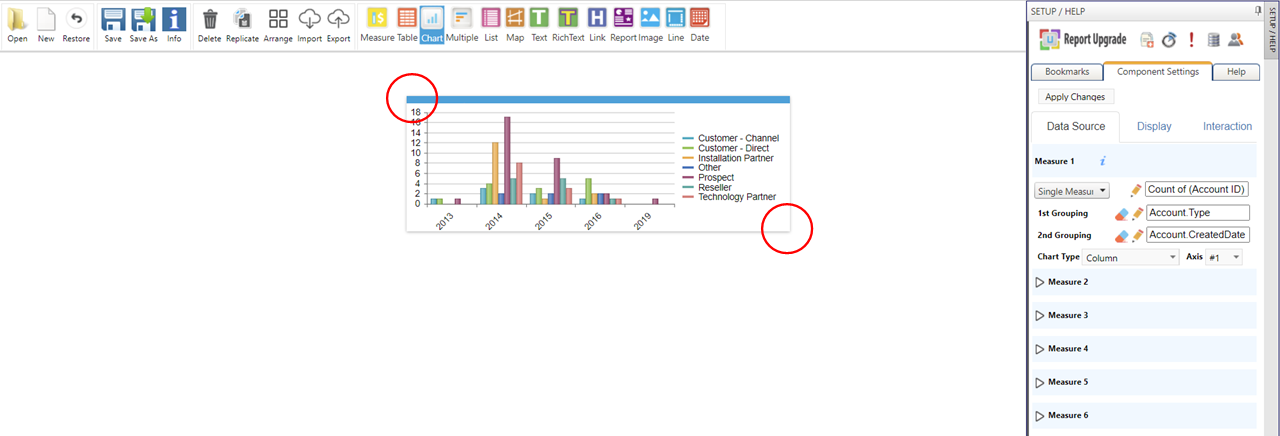
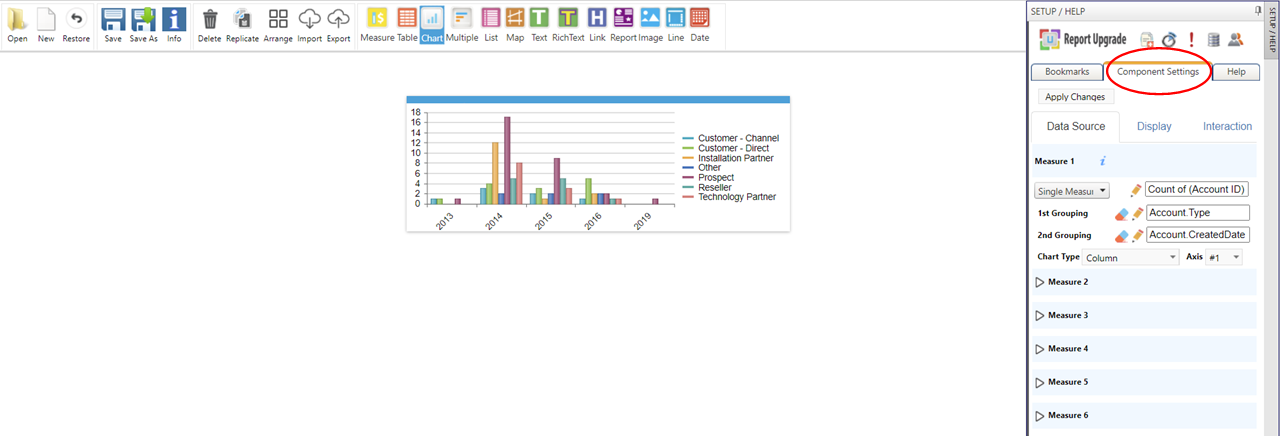
On the right hand side Component Settings tab, it shows all the settings related to the currently selected component. You can customize it to your preferences. Each component will have a different set of customizations available to it. To get more information about the options available for each type of component, refer to the the section Dashboard Components.
Saving Your Dashboard:
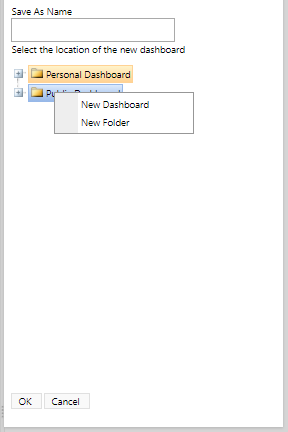
Once you have arranged your dashboard and customized the components, the next step is to save it. To save, go to the toolbar and click Save, a pop up window will prompt you to name your dashboard and select a folder to save it under. After you have named the dashboard and selected the folder you wish for it to be saved in, click OK.
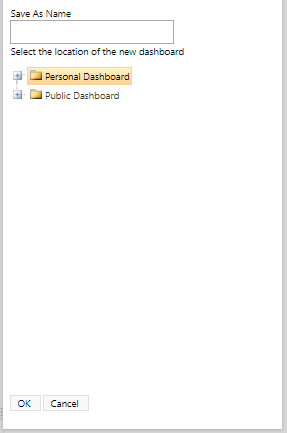
To create a new folder within a folder, right click on the parent folder and then select New Folder and name the folder.