Create Your Dashboards
 Create a Dashboard
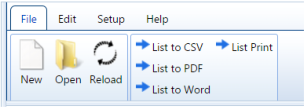
Begin by selecting the File tab. Then select the New button to open a blank dashboard.
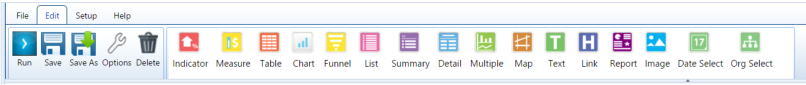
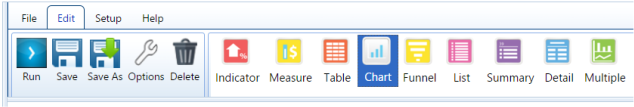
Once the blank dashboard has loaded, select the Edit tab to display your component options.
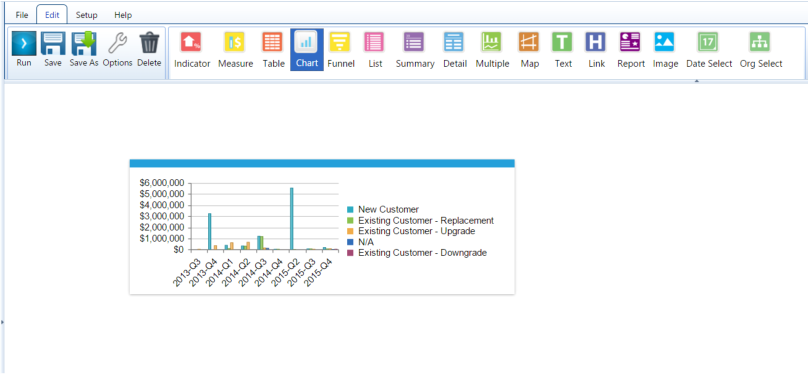
Begin by selecting any one of the component options, then dragging it onto the blank dashboard space. Once you have dropped the
component onto the dashboard, the actual component will load. You can drop the component anywhere on the dashboard, as well as
move and resize the component after it has loaded.
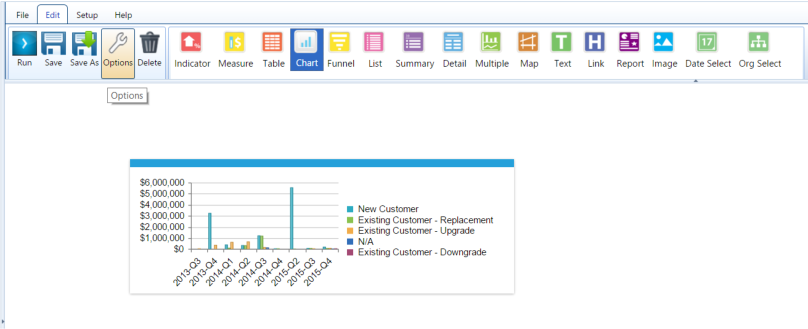
Once a component is dropped, click on the Options button on the top bar to modify the data it displays and customize it to your
preferences. Each component will have a different customization options in the Options window, however the majority of them will
contain Time Period Options, Data Options, Interaction Options and Display Options.
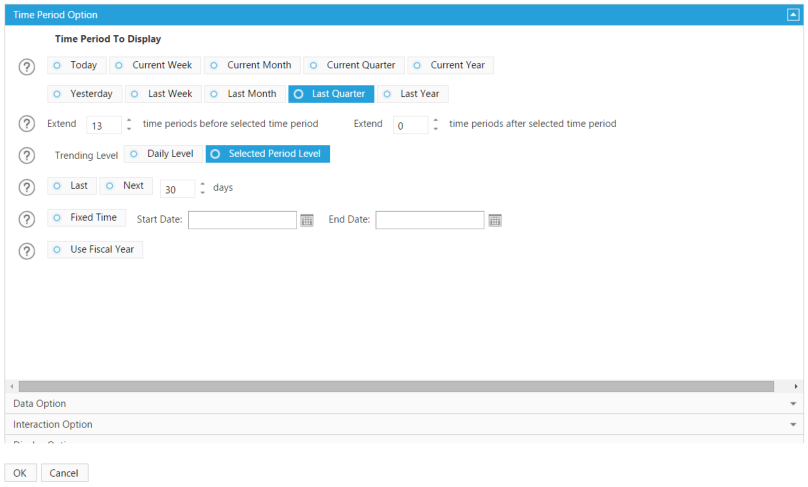
The Options window for the component will appear on the screen and you will be able to modify the time period you want your data
displayed by. Note the Help button circled in red. Simply click on any of the Question Marks to receive a detailed explanation of each
time period options.
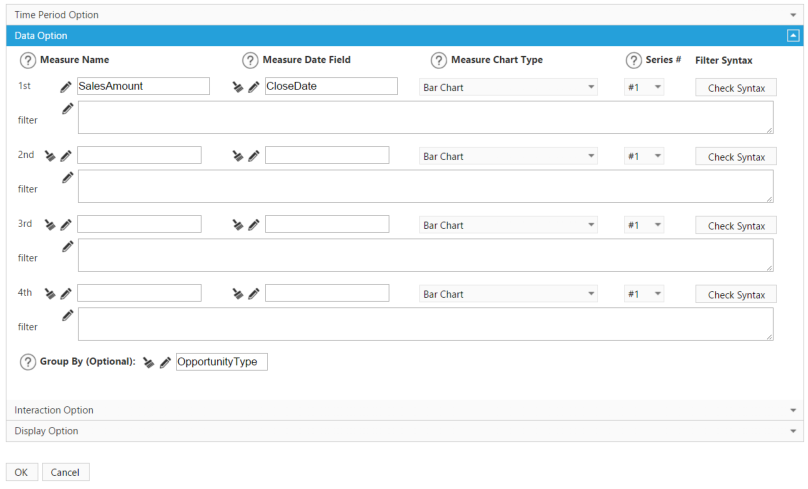
To modify the actual data shown, click on the Data Option bar underneath the Time Period Option window. You will then be able to
select the measures and objects you want to display
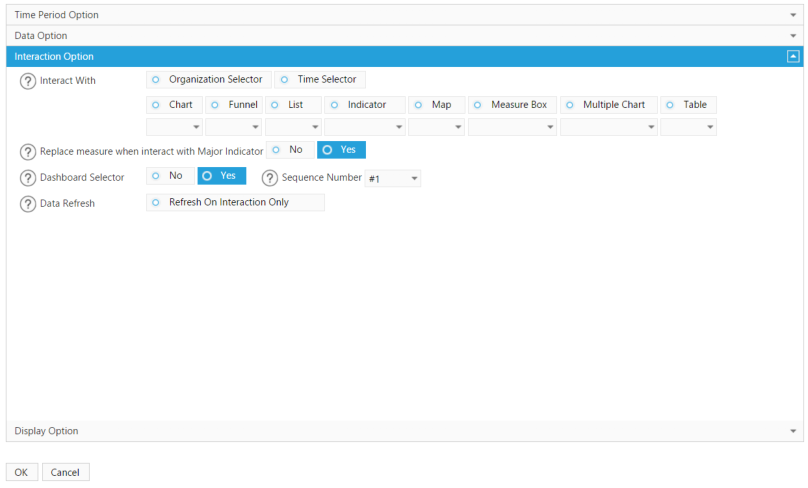
The Interaction Option window is where you will specify which components will cause this component to refresh. Likewise, by turning
on the Dashboard Selector function, you enable this component to send information to other components on your dashboard. In
order to receive that information, the other components’ Interaction Options will also need to be modified.
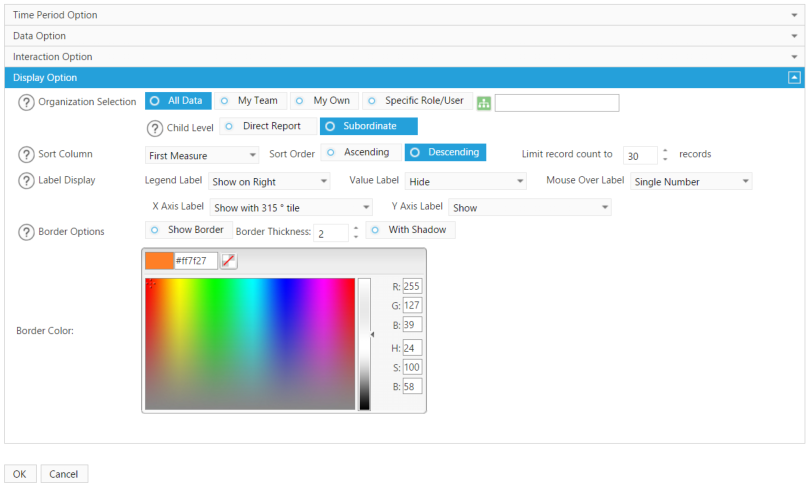
Finally, the last customization option is the Display Option window.
You can select which data is shown on your component under the Organization Selector. The component will default to All Data, but if you
would like to see a specific team’s data, or just your own data, select the options under Organization Selector.
You can also customize the display by showing your data in descending or ascending order under Sort Column. Notice that the component
will default to only show 30 record counts. If you would like to show a larger amount of records, enter the number in the Limit Record
Count box that you want to see.
Depending on the type of component, there are also options to label items and change the color of your borders. You can also customize
the border thickness, color and include a shadow if preferred. On the chart component there are options to label the X and Y axis, as well
as include a legend.
Once you have customized the component to your preferences, click OK to see the component reload with your customizations.
Saving Your Dashboard:
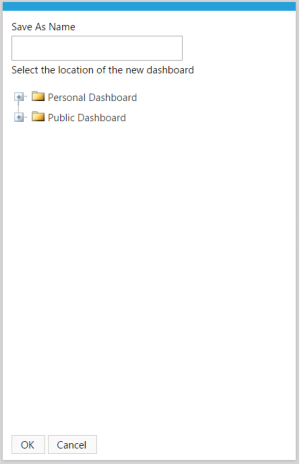
Once you have arranged the dashboard and customized your components, make sure to Save it. To save, go to the top bar and click
Save. A pop up window will prompt you to name your dashboard and select a folder to save it under. After you have named the
dashboard and filed it in a folder, click OK.
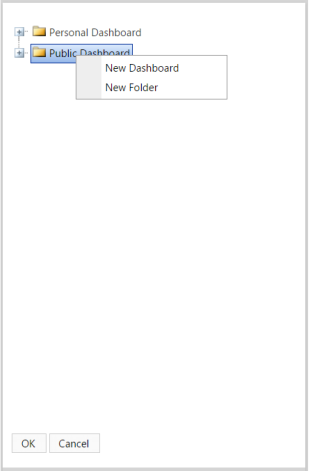
To create a new folder within Public Dashboard or Personal Dashboard, right click on the parent folder and then select New Folder. You
will be prompted to name this folder as well.
Once your dashboard is saved, click the Run button on the tool bar to exit Edit mode and begin using your dashboard.
Create a Dashboard
Begin by selecting the File tab. Then select the New button to open a blank dashboard.
Once the blank dashboard has loaded, select the Edit tab to display your component options.
Begin by selecting any one of the component options, then dragging it onto the blank dashboard space. Once you have dropped the
component onto the dashboard, the actual component will load. You can drop the component anywhere on the dashboard, as well as
move and resize the component after it has loaded.
Once a component is dropped, click on the Options button on the top bar to modify the data it displays and customize it to your
preferences. Each component will have a different customization options in the Options window, however the majority of them will
contain Time Period Options, Data Options, Interaction Options and Display Options.
The Options window for the component will appear on the screen and you will be able to modify the time period you want your data
displayed by. Note the Help button circled in red. Simply click on any of the Question Marks to receive a detailed explanation of each
time period options.
To modify the actual data shown, click on the Data Option bar underneath the Time Period Option window. You will then be able to
select the measures and objects you want to display
The Interaction Option window is where you will specify which components will cause this component to refresh. Likewise, by turning
on the Dashboard Selector function, you enable this component to send information to other components on your dashboard. In
order to receive that information, the other components’ Interaction Options will also need to be modified.
Finally, the last customization option is the Display Option window.
You can select which data is shown on your component under the Organization Selector. The component will default to All Data, but if you
would like to see a specific team’s data, or just your own data, select the options under Organization Selector.
You can also customize the display by showing your data in descending or ascending order under Sort Column. Notice that the component
will default to only show 30 record counts. If you would like to show a larger amount of records, enter the number in the Limit Record
Count box that you want to see.
Depending on the type of component, there are also options to label items and change the color of your borders. You can also customize
the border thickness, color and include a shadow if preferred. On the chart component there are options to label the X and Y axis, as well
as include a legend.
Once you have customized the component to your preferences, click OK to see the component reload with your customizations.
Saving Your Dashboard:
Once you have arranged the dashboard and customized your components, make sure to Save it. To save, go to the top bar and click
Save. A pop up window will prompt you to name your dashboard and select a folder to save it under. After you have named the
dashboard and filed it in a folder, click OK.
To create a new folder within Public Dashboard or Personal Dashboard, right click on the parent folder and then select New Folder. You
will be prompted to name this folder as well.
Once your dashboard is saved, click the Run button on the tool bar to exit Edit mode and begin using your dashboard.


 This will need to be selected on the other components, in order to receive information
from this chart component.
This will need to be selected on the other components, in order to receive information
from this chart component.
 This will need to be selected on this chart components,
in order to send information to other components
This will need to be selected on this chart components,
in order to send information to other components


Create a Dashboard
Begin by selecting the File tab. Then select the New button to open a blank dashboard.
Once the blank dashboard has loaded, select the Edit tab to display your component options.
Begin by selecting any one of the component options, then dragging it onto the blank dashboard space. Once you have dropped the
component onto the dashboard, the actual component will load. You can drop the component anywhere on the dashboard, as well as
move and resize the component after it has loaded.
Once a component is dropped, click on the Options button on the top bar to modify the data it displays and customize it to your
preferences. Each component will have a different customization options in the Options window, however the majority of them will
contain Time Period Options, Data Options, Interaction Options and Display Options.
The Options window for the component will appear on the screen and you will be able to modify the time period you want your data
displayed by. Note the Help button circled in red. Simply click on any of the Question Marks to receive a detailed explanation of each
time period options.
To modify the actual data shown, click on the Data Option bar underneath the Time Period Option window. You will then be able to
select the measures and objects you want to display
The Interaction Option window is where you will specify which components will cause this component to refresh. Likewise, by turning
on the Dashboard Selector function, you enable this component to send information to other components on your dashboard. In
order to receive that information, the other components’ Interaction Options will also need to be modified.
Finally, the last customization option is the Display Option window.
You can select which data is shown on your component under the Organization Selector. The component will default to All Data, but if you
would like to see a specific team’s data, or just your own data, select the options under Organization Selector.
You can also customize the display by showing your data in descending or ascending order under Sort Column. Notice that the component
will default to only show 30 record counts. If you would like to show a larger amount of records, enter the number in the Limit Record
Count box that you want to see.
Depending on the type of component, there are also options to label items and change the color of your borders. You can also customize
the border thickness, color and include a shadow if preferred. On the chart component there are options to label the X and Y axis, as well
as include a legend.
Once you have customized the component to your preferences, click OK to see the component reload with your customizations.
Saving Your Dashboard:
Once you have arranged the dashboard and customized your components, make sure to Save it. To save, go to the top bar and click
Save. A pop up window will prompt you to name your dashboard and select a folder to save it under. After you have named the
dashboard and filed it in a folder, click OK.
To create a new folder within Public Dashboard or Personal Dashboard, right click on the parent folder and then select New Folder. You
will be prompted to name this folder as well.
Once your dashboard is saved, click the Run button on the tool bar to exit Edit mode and begin using your dashboard.
This will need to be selected on the other components, in order to receive information
from this chart component.
This will need to be selected on this chart components,
in order to send information to other components
