|
<< Click to Display Table of Contents >> Overview |
  
|
|
<< Click to Display Table of Contents >> Overview |
|
Toolbar
The Toolbar is located at the top of the Report Builder. It provides a list of components that can be dragged and dropped into the report workspace, these components contain but are not limited to, report retrieve/save functions, and component functions like Delete, replicate or the open Options page for each component.

1. Take you back to the Homepage of the application (the dashboard viewing place).
2. Takes you to the Dashboard Builder.
3. Opens an existing report.
4. Creates a new report.
5. Allows you to preview the report which is currently being edited.
6. Save current report.
7. Save current report under a new name.
8. Allows you to see the information about a current report like report name, file location, and report id...etc.
9. Deletes selected component(s).
10. Replicates selected component(s). This will replicate the selected component along with all of its options and customizations.
11. Allows you to make changes to multiple components at the same time, including the ability to move to a different section, shift to a different location, align components, and delete components.
12. Opens the option page of the selected component.
13. Imports previously saved component into the current report.
14. Exports selected component for future use.
15. These are a list of components that can be used in the report. Please refer to the component section in the user guide for more detailed information about each component.
16. Opens the report template selector to select a template.
17. Opens the Report Upgrade user guide in another tab in the same browser.
Report Data Source
The Report Data Source selections are optional but for details on how the report data source works with the component data source, please refer to the Data Source & Join section of the user guide.
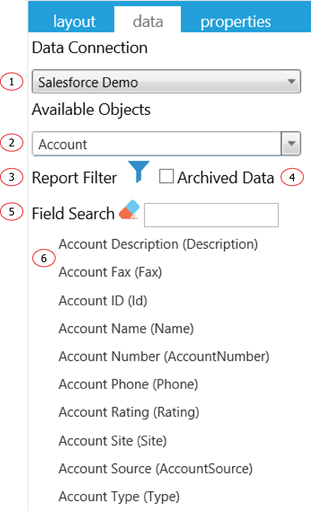
1. This is where you select a Data Connection
2. Provides a list of available objects/queries that will be available on the Available Objects dropdown list. Please select an object/query here.
3. Creates a filter to limit the report data.
4. In Salesforce, event data are archived automatically one year after the activation date, by default, it will be not included in the query. If you need to include the archived event data, check this box to have it included.
5. Search for an available fields by type in a partial or full name.
6. Provides a list of fields associated with the selected object(s) that will be available to be dragged and dropped into the workspace.
Report Properties
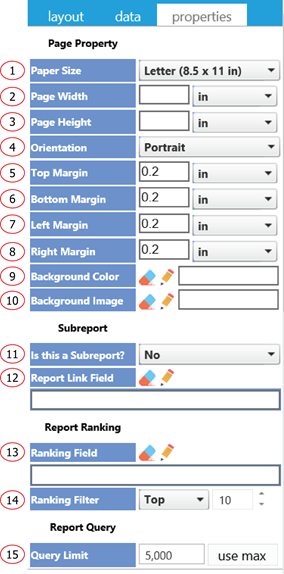
1. Paper size, the page size used for document rendering like PDF and printing.
2. The page width adjuster is for custom sizes only, there is no need to set this up if it’s a standard paper size provided in paper size dropdown list.
3. The page height adjuster is for custom size only. There is no need to set this up if it’s a standard paper size provided in paper size dropdown list.
4. The orientation of the report, by default, this is portrait.
5. This determines the top margin of the report.
6. This determines the bottom margin of the report.
7. This determines the left margin of the report.
8. This determines the right margin of the report.
9. The background color of the report, by default, this is white or no color.
10.The background image for the report, this allows you to select an image from your local device to display as the report background. The background image will only shows when the report is exported to other formats like a PDF.
11. If this report is created as a Subreport to be included within another report, select Yes. Otherwise, select No.
12. If this is a Subreport, the Report Link Field is the field that you use to it link to the main report.
13. Report can be ranked based on a field and there is where you would do it. For example, you can show only the top 10 sales representatives based on total sales. In this example, total sales will be the field used for ranking and should be selected in this field.
14. This determines how many values should be included in the report after the ranking is applied. In the example above, the top 10 sales representatives mean 10 is the number input in this field.
15. Each report query is subject to a row limitation. Put in the number of rows you want to be included in the report.
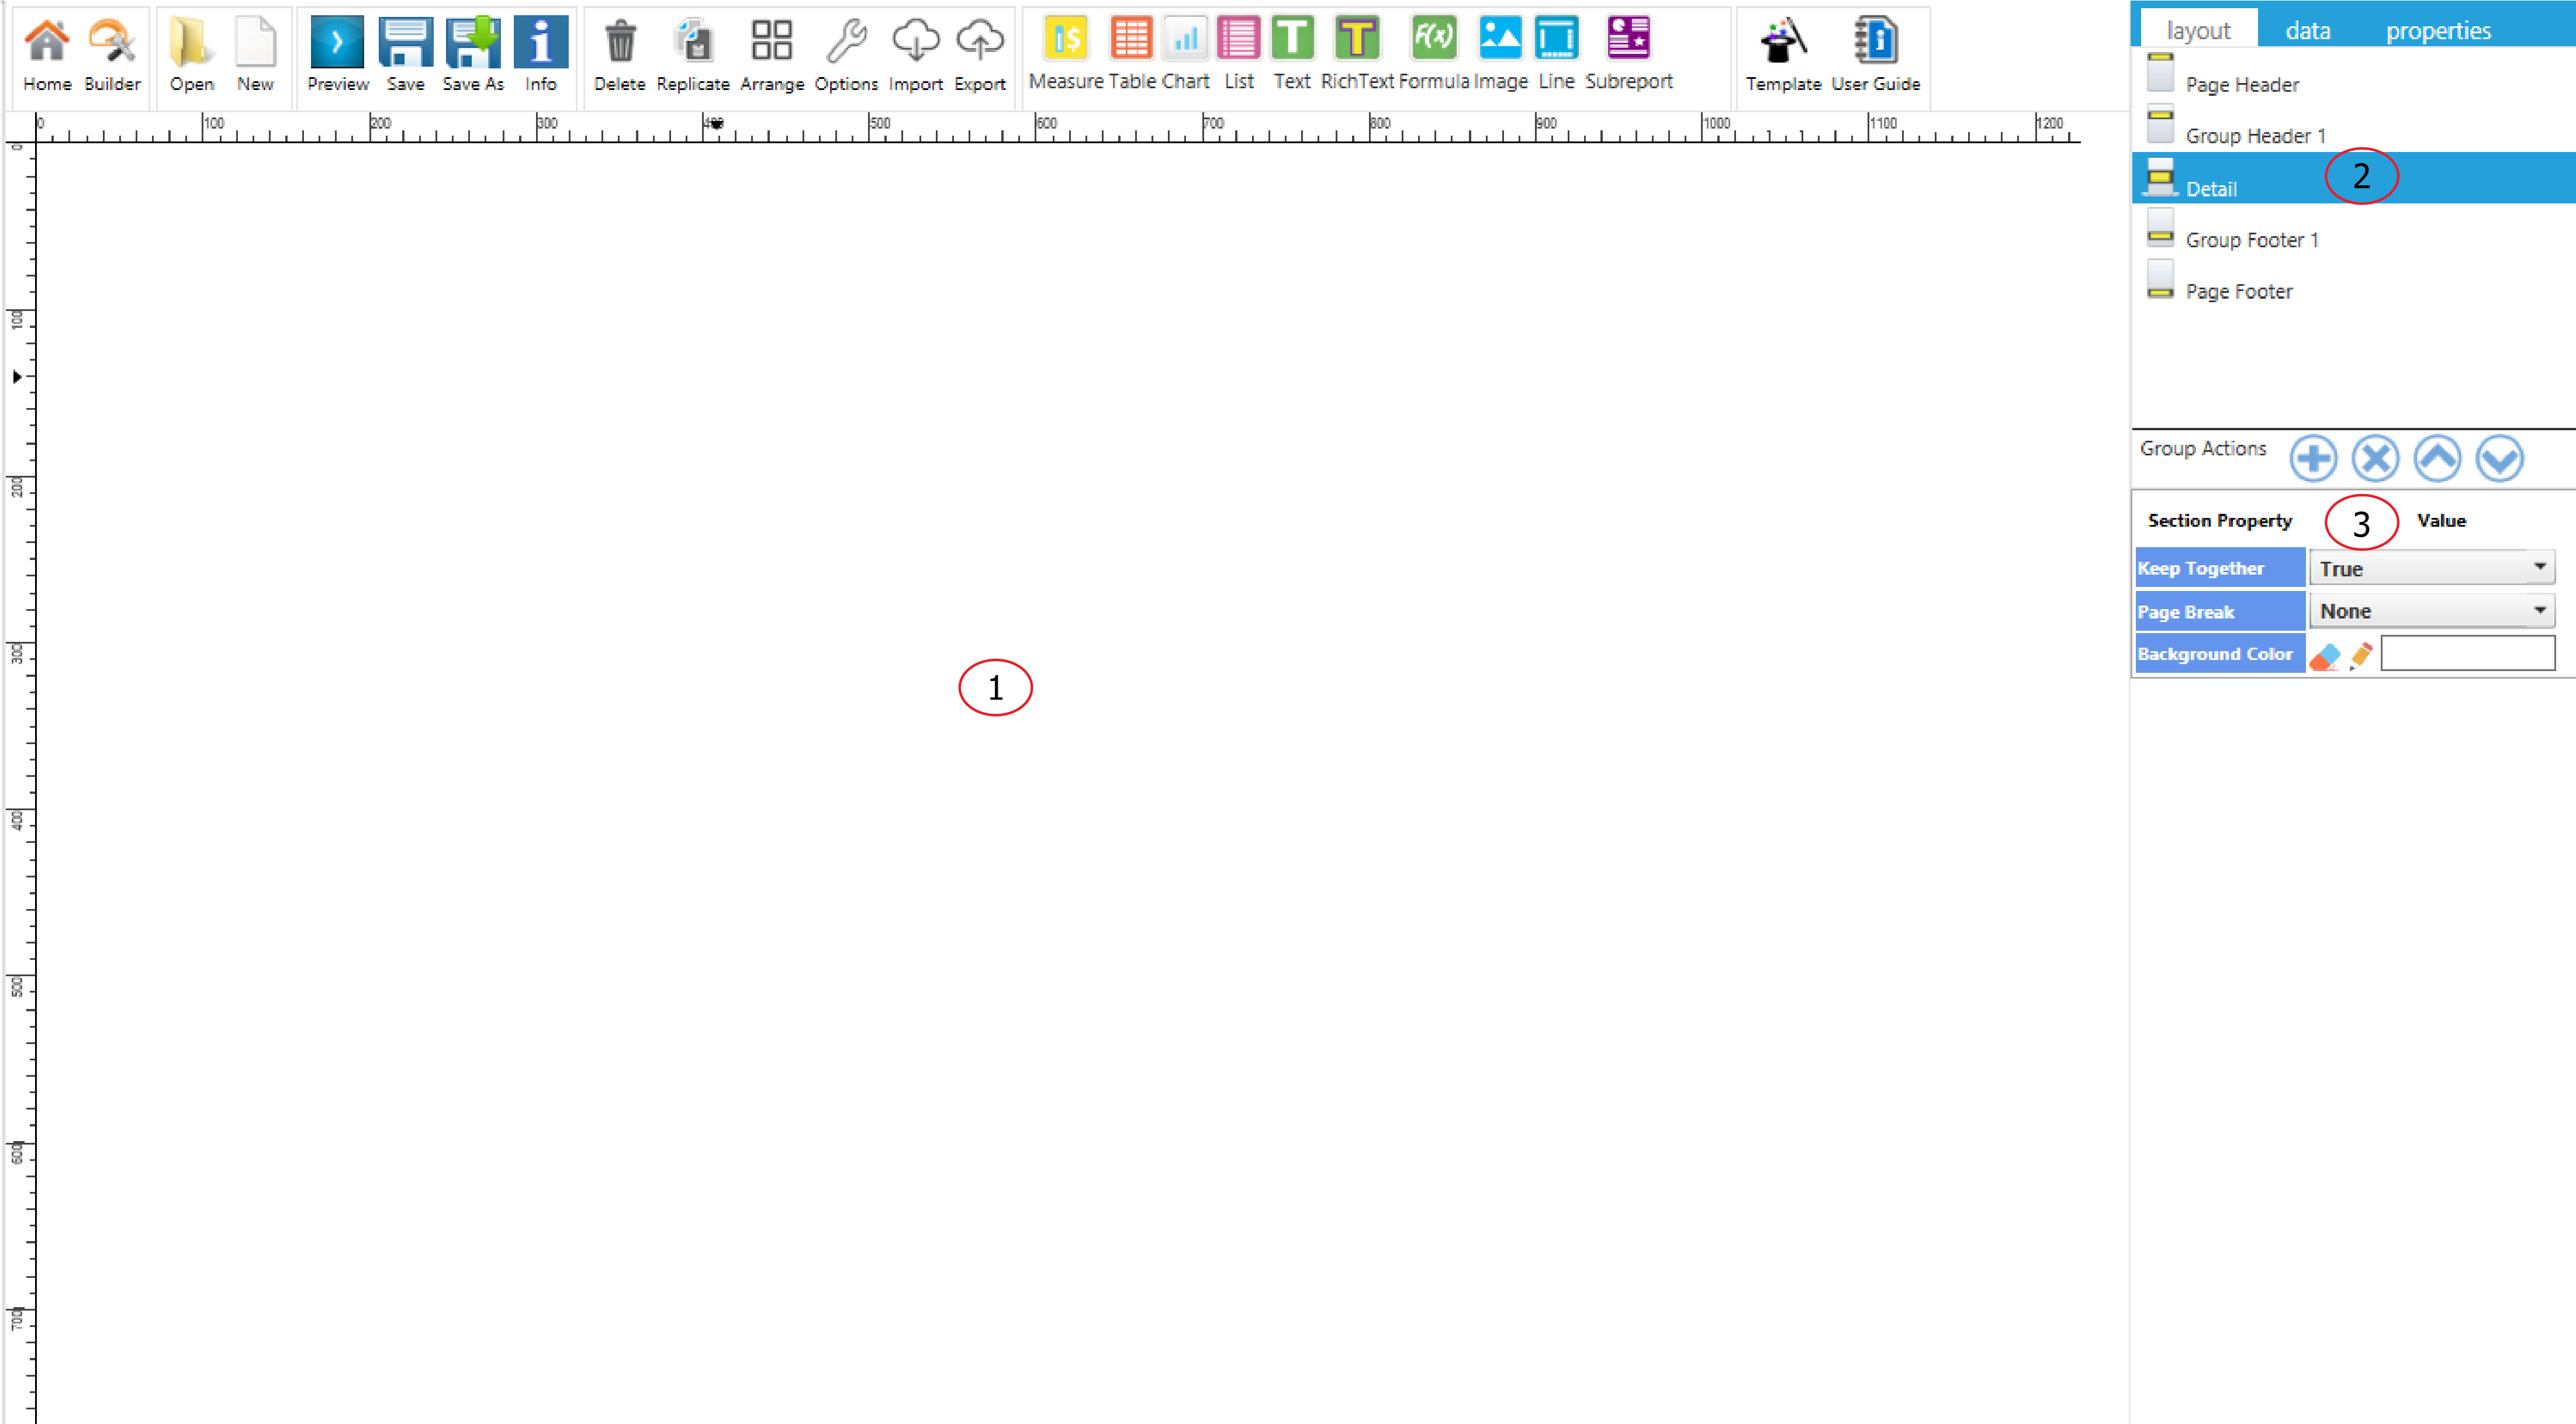
Report Layout
Each report can have many different sections for displaying and grouping purpose. Each section (2) has its own selectable properties (3) displayed below the sections. The workspace (1) on the left-hand side will be refreshed to reflect the elements existing in the selection section.
Page Header/Footer
The page Header/Footer option within the layout tab is the section used to display the report title, company logo or other information about the report itself.
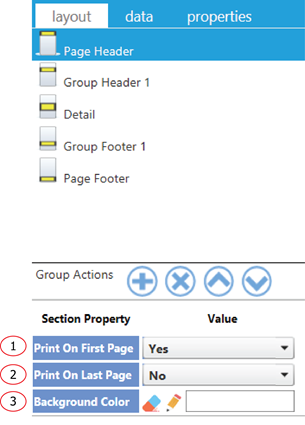
1. Print this section on the first page of the report.
2. Print this section on the last page of the report.
3. Select background color for this section.
Group Header/Footer
The group option is used to separate data into different groups, calculate values based on groupings, and sort data by a certain field. A report can have multiple group sections, groups can also be interacted with using the buttons under the Group Actions category. The plus button allows you to add a group, the "x" button allows you to delete a report, the up button allows you to move a group up in there order, and the down button allows you to move a group down in the order.
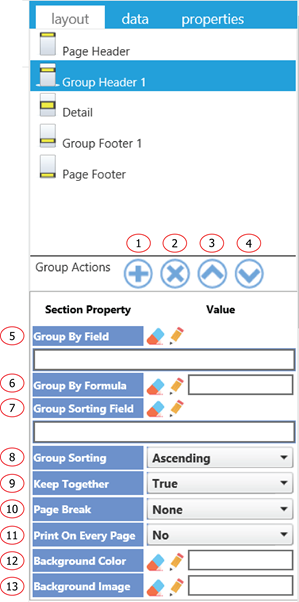
5. This allows you to choose a field to group this section by.
6. Instead of selecting from a single Group By field, a formula could be used as the grouping field, to edit the formula, click on the pencil icon.
7. This allows you to select a field that this group section will be sorted by, it can be the same field as the grouping or a different field.
8. Sort by ascending or descending order.
9. This keeps this section together or allow this section to separate into different 2 pages. When true is selected, the report will put the entire section on the same page if this section fits into one page, if the space on the current page is not enough for the entire section, it will be displayed on the next page.
10. Adds a page break before and/or after this section.
11. Print this section on every page if the detail section has more than one page within this section.
12. Allows you to add a background color for this section.
13. Allows you to add a background image for this section.
Detail
The detail section is the main section that is used to display record level details. These details will be grouped into their respective groups based on their section values.
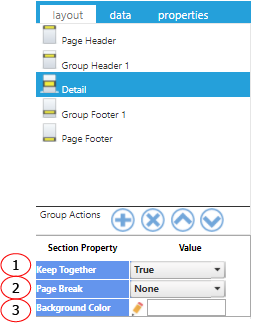
1. This determines if the section is kept together or is allowed to be separated into 2 different pages. When true is selected, the report will put the entire section on the same page (if this section fits into one page). That means if the space on the current page is not enough for the entire section, it will be displayed on the next page.
2. Add a page break before/after or both on this section.
3. Add a background color for this section.