|
<< Click to Display Table of Contents >> Chart |
  
|
|
<< Click to Display Table of Contents >> Chart |
|
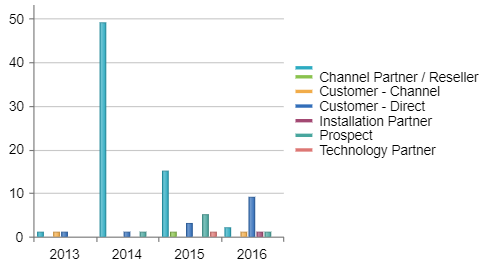
The Chart can display up to six measures at once while giving you the ability to select one measure. These six measures can be displayed in 21 different formats which can be changed in the Data Option window. This component can also be used as a dashboard selector.
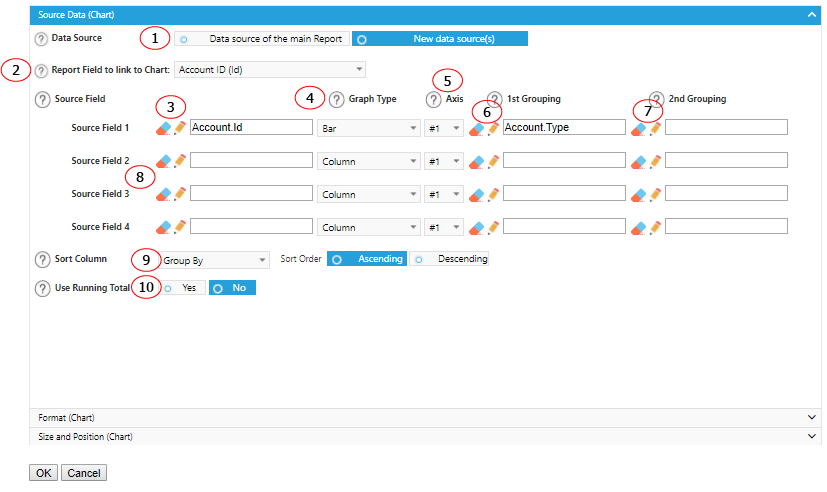
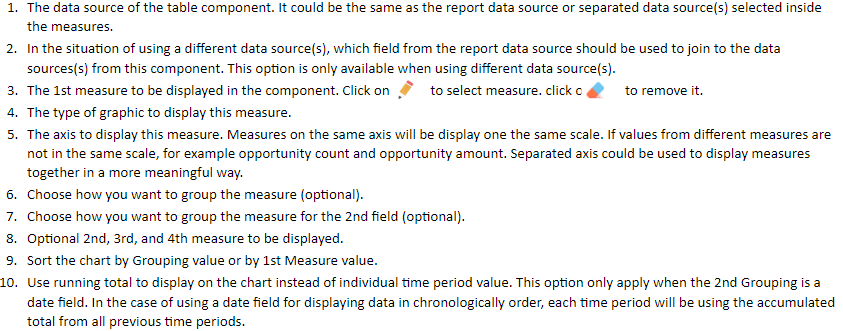
Options - Source Data
Options - Format
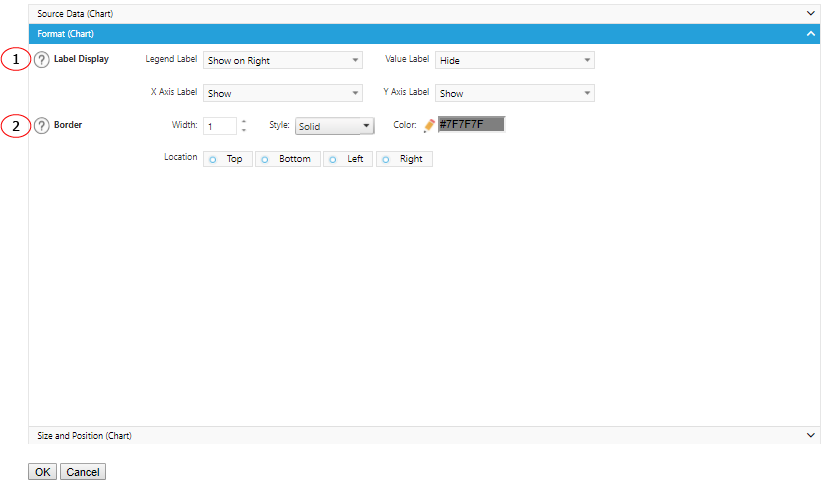
1. Choose how you would like the labels for your chart displayed by choosing from the drop down bars for each part of the chart.
2. Add some emphasis to your component by choosing the Show Border and/or With Shadow boxes and choose a custom color and size for your border.
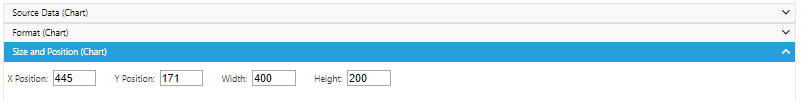
Options - Location and Size
The displaying location and size of the component.