|
<< Click to Display Table of Contents >> Table |
  
|
|
<< Click to Display Table of Contents >> Table |
|
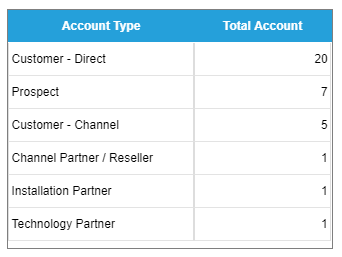
The Table is capable of displaying up to four measures and their subsequent groups. This component is mainly used for comparison purposes but can also be a dashboard selector.
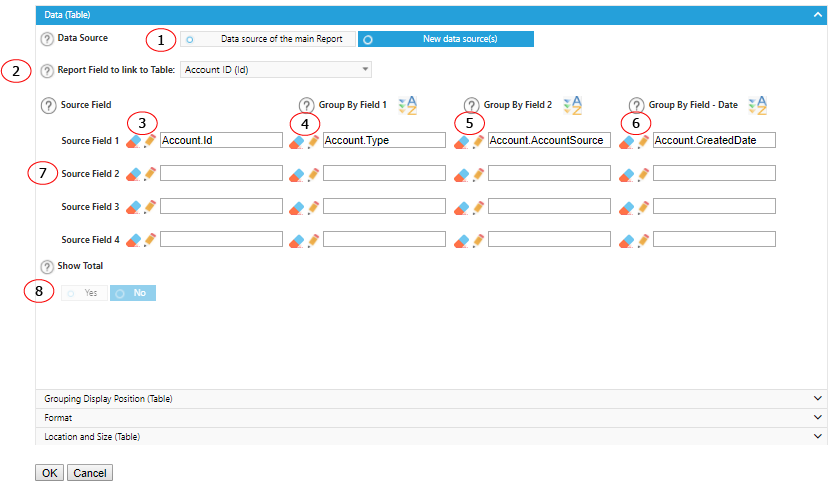
Options - Source Data
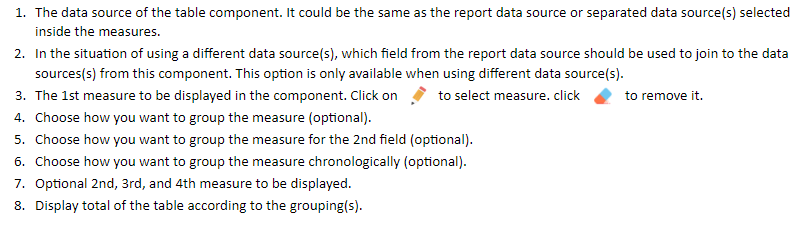
Options - Grouping Display Position
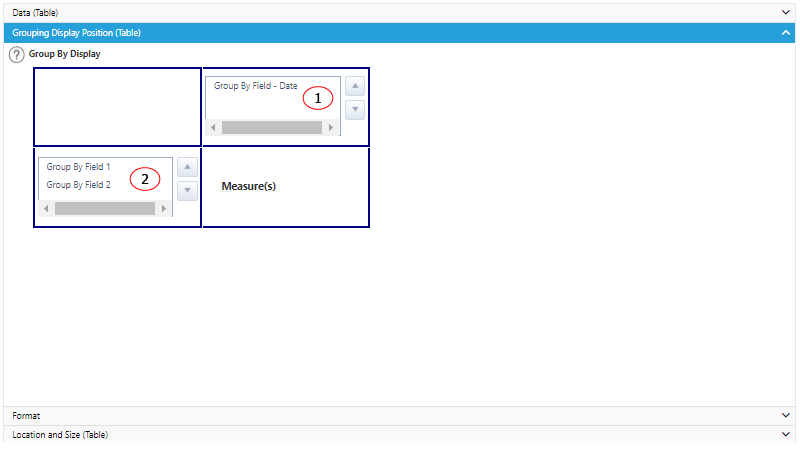
Drag and drop the Group By field to arrange the display - put grouping on row or on column.
Options - Format
Some table component options will only showing on the actual report and not on Builder components. To have an accurate view of how it a format option changes the look of the report, please use report preview function to review it.
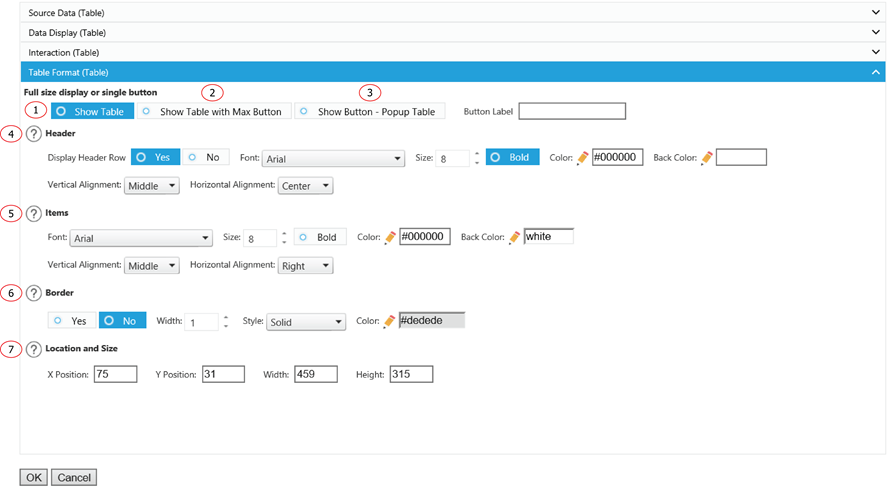
1. Display the Chart as a normal chart.
2. Display the Chart as a normal chart with a max button to max out the Chart size.
3. Instead of displaying the Chart, it displays a clickable button. You can customize the label for the button. The Chart will show up as a popup window when a user clicks on the button.
4. Header row formatting options. To hide the header row, select the row height to the minimum.
5. Table item formatting options.
6. Add some emphasis to your component by choosing the Show Border and/or With Shadow boxes and choose a custom color and size for your border.
7. The displaying location and size of the component.